Why Ultrasonic flow sensors provide a more detailed picture of the ‘real’ flow characteristics of a fluid
Ultrasonic flow meters produce data that can appear somewhat different to other types of precision flow meter due to the unique characteristics of the measurement method.
These differences often reveal nuances about how the flow is really behaving, which may not have been observed before, and understanding their nature and origin is key to getting the most out of this type of instrument.
Device Construction and Flow Damping
 An ultrasonic flow meter (USFM) has no moving parts and places no obstruction in the fluid path other than its own internal fluid channels, the dimensions of which are chosen to be suitable for the maximum flow rate the instrument is designed to measure.
This open construction differs from most other flow meter types, which have solid and/or moving components in the flow, and which act to heavily damp any vibration or other transient effects which would occur in the flow if the meter were not present.
This damping effect is not necessarily undesirable. A positive-displacement meter, for example, may produce measurements relatively infrequently, but the variance between one measurement and the next is small because the mechanical nature of the instrument tends to smooth out the flow and produce a clean average. Often, this is exactly what’s required, and many engineers and technicians are well used to seeing a smooth, steady trace on a data logger.
By contrast, the USFM introduces very little mechanical damping. The fluid is free to accelerate, slow down, and even reverse direction without impediment, and the rapid response of the USFM preserves this behaviour in great detail.
This leads to a common complaint that data from the USFM is “noisy”. Determining the ‘noise floor’ of the instrument is essential in order to understand what the data actually represents.
Determining the Noise Floor
From an end-user viewpoint, there are two fundamental components to the noise floor of a USFM.
The first can be considered ‘electronic noise’. This is the contribution from the underlying flow measurement system consisting of the two transducers and the electronics which drive them, and includes:
- uncertainty in making the time-of-flight measurements, due to electrical noise and the finite resolution of the internal clocks and data converters
- interference caused by the fact that ultrasonic waves do not propagate in nice straight lines directly from one transducer to the other, but instead spread out and bounce around just like the sound from any other loudspeaker
This noise can be observed by monitoring the output of the USFM under zero flow conditions, and when all nearby external sources of vibration have been switched off to ensure that the fluid inside the sensor is completely still.
Typically this contribution is small under normal operating conditions. It doesn’t vary with flow rate.
The second component is ‘fluid noise’, and is a direct result of the turbulent flow of the fluid within the instrument. The flow profile across the cross-section of the internal measurement tube is chaotic and time varying, which results in the ultrasonic pulses sometimes arriving slightly ahead of time, and sometimes slightly delayed. This variation in arrival time manifests as variance in flow rate.
This contribution scales more-or-less linearly with flow rate, but can be hard to quantify without a perfectly ‘quiet’ source of flow to measure. One option for the curious is to use a static header tank filled with fluid and a tap downstream of the USFM to control the flow rate. This can produce a very quiet flow which allows the true noise floor of the USFM to be determined.
Dynamic Flow Characteristics
In many installations – especially those not designed with metrology in mind – the noise floor of the USFM is low compared to the variation in flow which actually exists in the system.
It is here that the lack of mechanical damping introduced by the USFM becomes most apparent. A side by side comparison of the output of the USFM with that of another type of flow meter can, at first glance, make it look as though the USFM is ‘noisy’, while the other meter is ‘nice and smooth’.
When comparing the results from different flow meters – or, indeed, any two different instruments which measure the same quantity – it is important to ensure that the measurement bandwidth is the same in both cases. For example, a positive-displacement meter might generate data at a rate of 10 useful measurements per second, and each of those data points represents the average flow rate through the instrument over that 1/10 second period. When plotting this data on a chart, the individual points are spaced 1/10 seconds apart along the time axis, and may be joined with straight lines or smooth curves.
A USFM, however, may take 1000 or more measurements per second internally, and from these it may derive and transmit 100 data points per second. Plot these on the same axes, and it is likely that the peak-to-peak variation will be higher than the positive-displacement meter – but this isn’t a like-for-like comparison because the USFM is resolving much more detail about how the flow is really changing over time within the fluid circuit.
To make a like-for-like comparison, it would be necessary in this case to apply a low-pass filter to the output of the USFM, in order to reduce its bandwidth to match that of the positive-displacement meter. A simple way to do this might be to take an average of each consecutive block of 10 data points from the USFM, or to apply some other linear low-pass filter with a sharp cut-off at 5 Hz.
Example – The Effect of Bandwidth on Dynamic Response

The graph above shows the difference between a high bandwidth and a low bandwidth instrument both measuring the exact same underlying quantity. In this case, a sudden, brief reversal in the direction of flow occurs, which is very typical of what happens in an automotive fuel system when the injectors are closed.
A low bandwidth instrument shows a smooth trace, but it completely fails to reveal that the flow is reversing direction.
Summary and Further Reading
While data produced by a USFM can appear very different to other types of mechanical meter, the measurement method used and elimination of flow damping allows the true dynamic flow characteristics to be understood.
Engineers now have access to valuable information to better understand the true performance and efficiency of fluid flow systems, aiding future development.
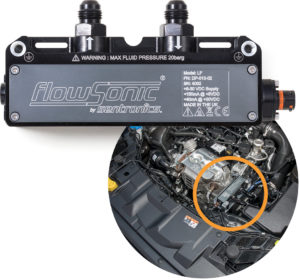
Sentronics FlowSonic flow meters use next-generation ultrasonic technology to measure fluid flow, with low-pass filters that can be programmed to suit the needs of the application, or disabled completely to maximise speed of response. Sentronics technology is used by global Automotive OEMs, heavy-duty vehicle manufacturers and test houses for analysing fuel consumption and efficiency of coolant systems.
Find out more about how Sentronics technology is employed: